AI Magic
AI Magic
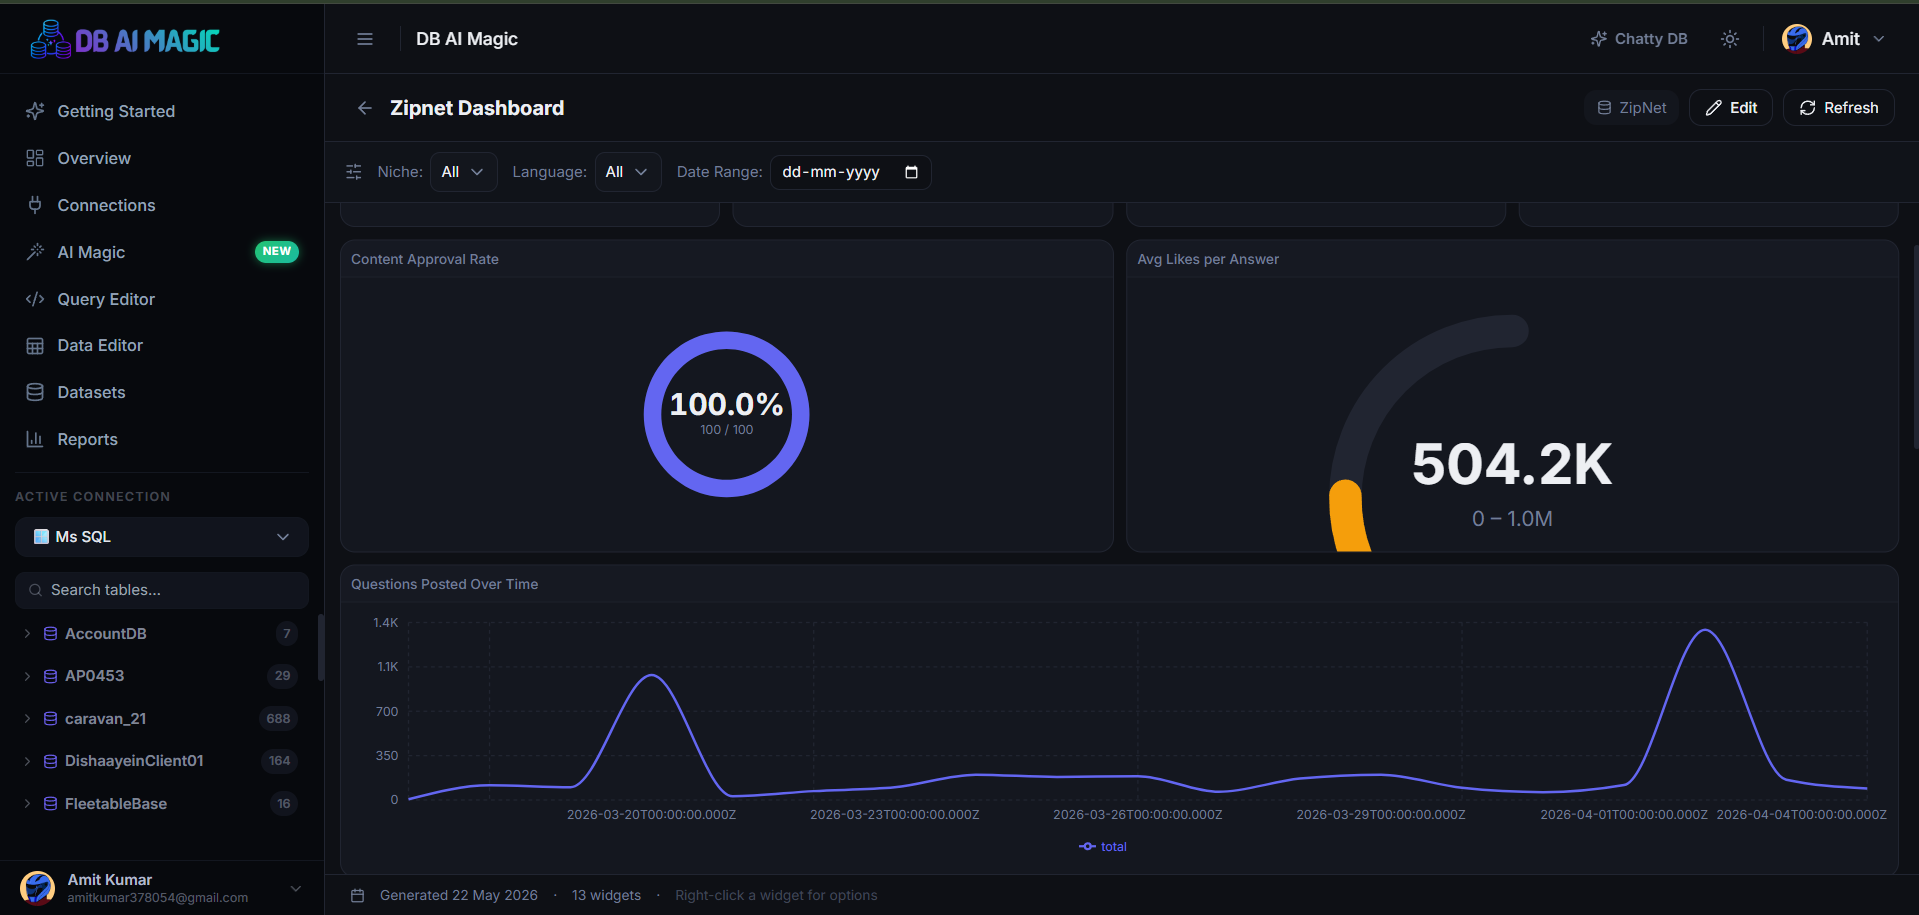
Point at a database, describe what you want in one sentence, and DB AI Magic assembles a complete multi-widget dashboard.
What it is
AI Magic reads your schema, decides what's worth measuring, writes the SQL behind each widget, and lays everything out on a ready-to-present canvas. The whole process takes seconds.
When to use it
- You've just connected a new database and want a snapshot of what's in it.
- A stakeholder asks for “a quick dashboard” — you want a starting point in under a minute.
- You're prototyping reports for a new feature and want to see what KPIs are obvious before designing manually.
How it works
- You pick a connection + database and optionally describe what you want.
- DB AI Magic introspects the schema (tables, columns, foreign keys).
- The AI proposes a dashboard plan — KPIs, tables, charts, filters.
- Each widget's SQL is validated; bad SQL is auto-retried with feedback.
- The finished dashboard appears in your hub, ready to view and tweak.
You're always in control
Generated dashboards are real DB AI Magic dashboards. Open any widget to see the SQL, change the chart type, or replace the dataset entirely. Nothing is hidden away.
Limits and quotas
Each plan includes a number of AI Magic generations per month. Once you hit the limit we tell you up-front — no surprise charges. You can also bring your own AI provider key on Pro and above to bypass the included quota entirely.
Continue to Generating Dashboards for the actual step-by-step flow.