Getting Started
Introduction
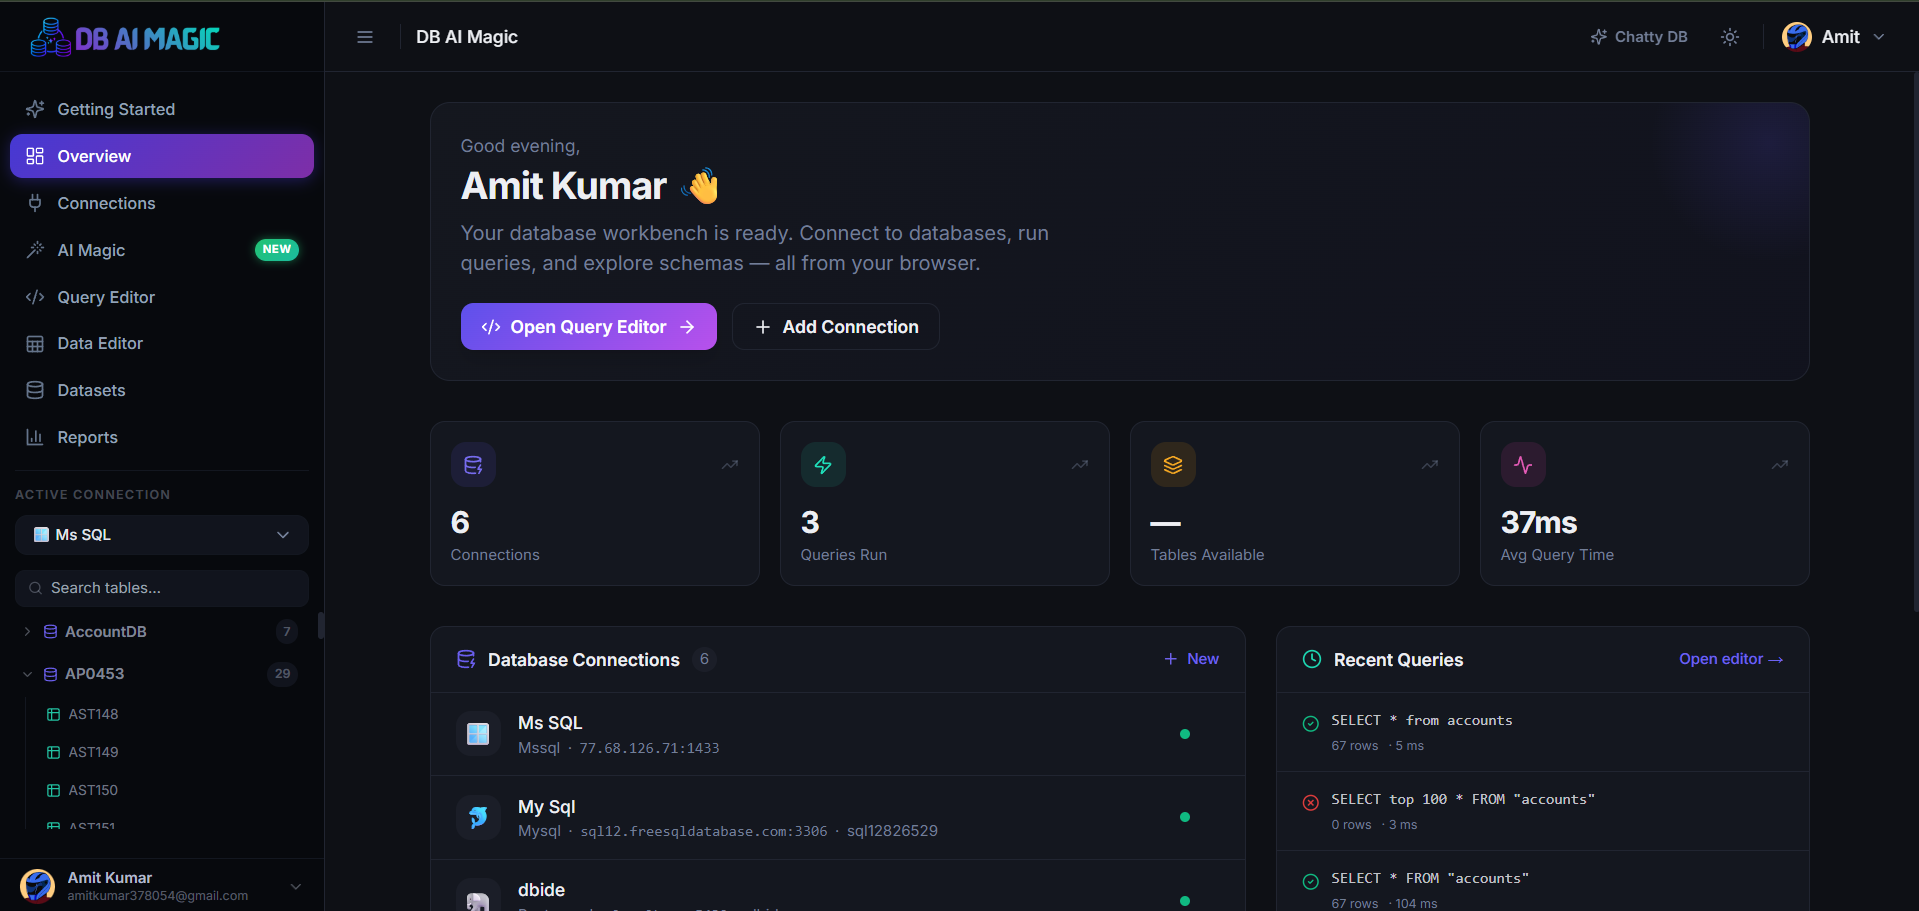
DB AI Magic is a unified, browser-based workspace for working with every database your team uses — from writing the first query to publishing a polished report.
What is DB AI Magic?
DB AI Magic is a complete database workbench you can open in a tab. It connects to 20+ database engines, gives every database the same friendly interface, and layers on a query editor, a spreadsheet-style data editor, a schema visualiser, BI dashboards, and an AI assistant that can write and run SQL for you.
Everything lives in one workspace, so you can go from “I need to check production” to a shared dashboard without leaving your browser or installing native drivers.
What you can do
Run SQL
Multi-tab editor with autocomplete, history and streaming results for big queries.
Edit data
Edit rows in a spreadsheet UI without writing INSERT/UPDATE statements.
Explore schema
Browse databases, tables, columns, indexes and foreign keys visually.
Build reports
Drag widgets onto a grid, share with a public link, or export to PDF.
Ask in plain English
Use AI Chat or AI Magic to turn a question into SQL and charts.
Invite a team
Add admins and employees with granular per-connection permissions.
How it fits together
Every account belongs to an organization. Inside that org you save connections to your databases. Each connection becomes the source for queries, reports, datasets, and AI conversations.
Roles control who can do what. The owner of the organization is a Super Admin, who can promote admins and invite Employees with fine-grained permissions per connection.
Your first five minutes
Sign in
Use Google to create your workspace. You become the Super Admin of a new organization automatically.Add a connection
Go to Connections, pick your database engine and paste your credentials. We test the connection live before saving.Run your first query
Open the Query Editor, choose your new connection and start typing. Results stream into the grid as the database returns them.Build something visual
Save a query as a dataset, drop a chart and a KPI tile onto a report, and share the public link with a teammate.Choose Plan
Go to Pricing Plans to choose the right plan for your team for more features.
Prerequisites
What you'll need
Next steps
- Plans — pick the right plan for your team or stay on Free forever.
- Supported databases — full list of engines and what each one supports.
- Creating a connection — start connecting your databases now.